
The September 2025 Power BI Feature Summary lands alongside FabCon Vienna, mixing Copilot enhancements, long-awaited modeling improvements, and a handful of reporting updates. Compared to recent months, this release feels like a tale of two halves: Copilot expanding for business users and serious modeling breakthroughs for developers.
We know that Power BI release notes can be overwhelming, so our aim with these posts is to cut through the noise and provide a quick summary of the features we find genuinely useful, interesting, or exciting. Whether you are a report designer, data modeler, or business stakeholder, our focus is to highlight updates that offer the most value for real-world reporting and analytics.
Copilot Becomes More Practical
Copilot is moving from novelty to necessity. Beyond the headline “default on” rollout, several subtle but important improvements dropped this month:
- Auto workspace selection means fewer setup headaches and less confusion about eligibility.
- Report discovery in Microsoft 365 makes finding content easier where people already work.
- Filter-aware summaries and smarter search improve accuracy and context when querying data.
The standout here is that Copilot feels less like an isolated chatbot and more like part of the Power BI workflow. The ability to save Explorations to Pro workspaces is especially welcome for teams who aren’t on Premium, helping democratize AI-driven analysis.
DAX User Defined Functions (Preview)
This is the developer highlight of the month. Reusable, parameterized DAX functions finally make it possible to standardize complex logic, reduce repetition, and enforce consistent calculations across models.
For larger teams or consultants juggling multiple clients, this could be transformative. No more hunting through dozens of measures to update a calculation. Maintain it once, reuse it everywhere. Expect a learning curve, but the long-term payoff in governance and maintainability is huge.
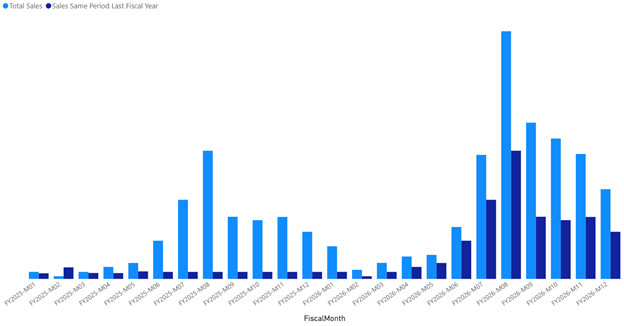
Enhanced Time Intelligence (Preview)
Power BI’s time intelligence has historically been rigid, tied to a standard calendar. September changes that with support for custom calendars; fiscal, retail 4-5-4, or week-based. Functions like TOTALWTD and PREVIOUSWEEK will resonate with industries where fiscal calendars rule the reporting cycle. We can’t wait to roll out our first native fiscal calendar feature.
Modeling Without Desktop
For years, Desktop has been a non-negotiable in the Power BI workflow. That’s starting to change:
- Web modeling is now GA, meaning you can create and manage models entirely in the service.
- Direct Lake editing in Desktop (GA) and TMDL GA strengthen the bridge between Fabric and Power BI.
- PBIX download restored for XMLA-modified models, another governance win.
This shift reflects Microsoft’s push toward a service-first experience, aligning with Fabric’s broader ecosystem.
Reporting and Other Bits
Reporting was quieter again this month, though two items stand out:
- Performance Analyzer in the web makes optimization possible post-publication, not just in Desktop.
- Translytical Task Flows on by default. A mouthful but essentially enabling action directly from reports.
Visuals updates felt minor by comparison, with incremental improvements from Zebra BI, Powerviz, and ZoomCharts.
With regard to Translytical Task Flows, he jury is still out for us. We see Power BI as the premier read-only analytics tool, and while Microsoft continues to blur the lines between analytics and action, this particular feature doesn’t feel mature enough yet.
In our view, translytical flows still come across as clunky and dated in their approach. The UX isn’t seamless, and the logic often feels bolted on rather than native to the reporting experience. For lightweight actions, maybe they have a place, but for any process that really matters, Power Apps or dedicated workflow tools remain far better options.
That said, it’s worth noting that Microsoft keeps nudging Power BI into a more operational role, so even if this isn’t the breakthrough moment, it’s a signal of the direction the platform is heading.
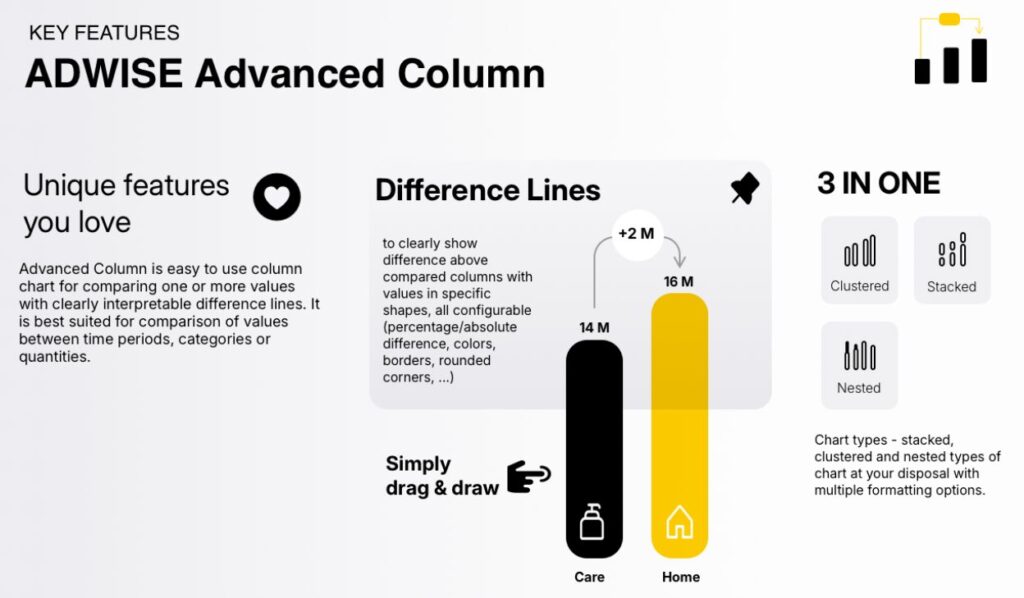
Custom Visuals
Adwise Advanced Column looks sexy. We’re not fans of the name (Adwise gives off the wrong vibe, like ads are somehow involved), but credit where it’s due: the difference lines look mint. It’s a small but impactful design choice that elevates comparisons and trends in a way the native visuals can’t match.
We’re looking forward to putting this visual through its paces. As always, custom visuals can be hit or miss in terms of performance and support, but this one feels like it could quickly find a home in dashboards where clarity and design polish matter.
Final Thoughts
September’s update is a mix of AI usability and serious modeling innovation. Copilot continues to evolve from a flashy demo to a tool that genuinely saves time, while DAX UDFs and enhanced time intelligence address long-standing developer frustrations.
If August was about embedding AI into workflows, September is about strengthening the backbone; cleaner models, smarter governance, and more flexibility for complex business calendars.
It’s not the most glamorous release for report designers, but for those working in modeling, architecture, or governance, September might be one of the most important updates of the year.
For the full feature list and technical detail, see the official Power BI September Feature Summary.
Ready to Transform Your Reports?
If your Power BI reports are looking basic or tired, now is the perfect time to reach out to us. Our team specializes in transforming existing Power BI assets into cutting-edge designs that match your brand and elevate your data presentation. Contact us today to discuss your project and see how we can help.
In a hurry? We have professionally crafted Power BI templates ready to go in our Template Store.