
The October 2025 Power BI Feature Summary brings a practical set of improvements: a long-signalled move away from Bing Maps, Copilot that now drafts DAX queries, small but pleasing reporting tweaks, and a handful of interesting custom visuals. We’re keeping this tight and opinionated so you can decide what’s worth your time.
We know that Power BI release notes can be overwhelming, so our aim with these posts is to cut through the noise and provide a quick summary of the features we find genuinely useful, interesting, or exciting. Whether you are a report designer, data modeler, or business stakeholder, our focus is to highlight updates that offer the most value for real-world reporting and analytics.
Bing Maps → Azure Maps (finally pick a lane)
Microsoft is steering everyone off Bing Maps and onto Azure Maps. The icon may linger in Desktop for continuity, but the visual is still headed for deprecation; paginated report migration is in two phases (authoring now on Azure Maps in Report Builder, service switch finishing mid-November). In short: migrate new work to Azure Maps now unless you’re in sovereign clouds or specific regions.
Pros: better long-term support, modern layers, and alignment with the wider Azure geo stack.
Cons: some folks will miss the address-only geocoding ease; Azure Maps often nudges you toward coords and region scopes, which can mean a little more prep. Community roundups are already telling people to plan their conversions rather than waiting for a date drop.
A light joke we can’t resist: if you’re still building new reports on Bing Maps in late 2025… why?
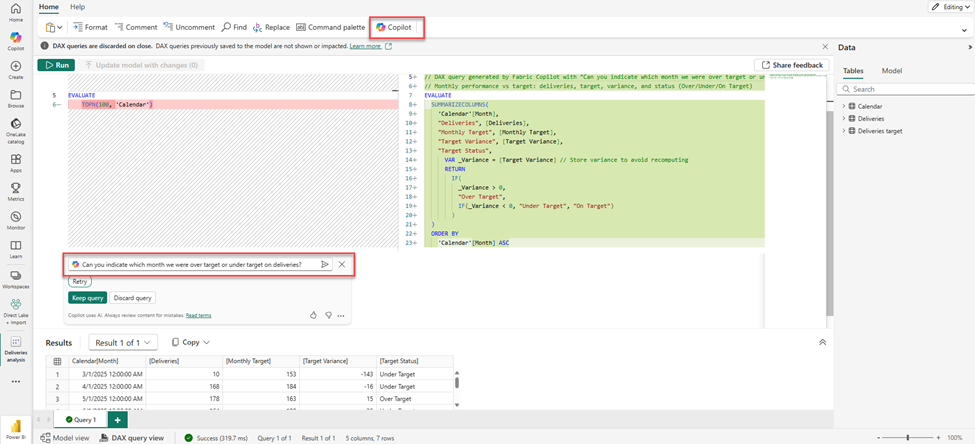
Copilot can now write DAX queries (GA)
Copilot now drafts DAX queries directly in DAX Query View on Desktop and the web. Describe the question, Copilot proposes the query, you iterate, run, and keep what you like. It’s grounded in the semantic model and your “Prep for AI” instructions. This has been building for months; now it’s mainstream.
Will pros still ask ChatGPT for DAX? Sure. But having an inline assistant that understands your model metadata, descriptions, and verified answers is a quality-of-life win, and less context-switching for quick explores. Chris Webb’s earlier write-up captured the appeal well: the experience sits where you’re already working and avoids data-movement worries.
Button slicer: Cross-highlighting lands
The Button slicer is GA and now supports cross-highlighting, plus auto-grid and accessibility polish. It behaves more like the chiclet slicer people love, dimming unrelated values yet keeping them visible — a small UX change that helps users “read” filter context faster. Community posts are already flagging it as a nice everyday improvement.
Tables: “Grow to fit” — f***ing finally
There’s a new “Grow to fit” resize behavior for tables that spreads spare width across your columns so you don’t babysit layouts. Manual widths still win, but for most layouts this is the set-and-forget we’ve all wanted. You can pair it with “Auto-size width” as needed. People have been cheering this one (and, on Reddit, still begging for per-column width presets).
Quick hits we noticed
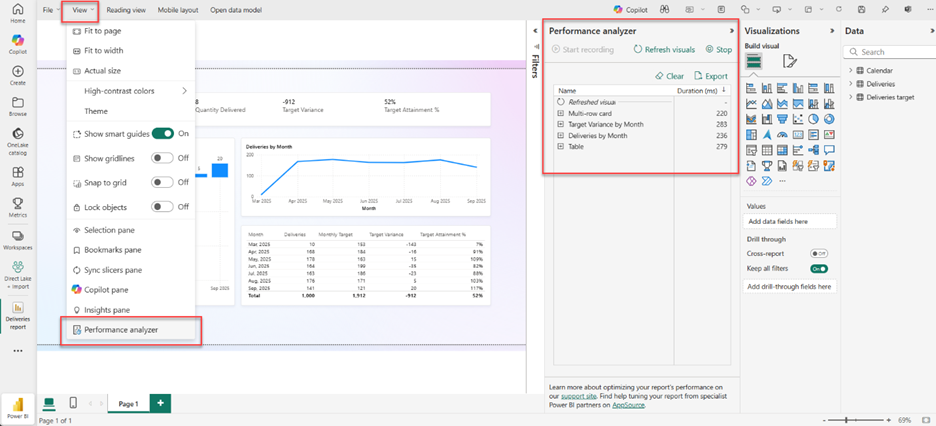
Performance Analyzer in web is rolling out after a slight delay, helpful for validating load times where users actually consume reports.
Export Query Results (Preview) lets you push cleaned Power Query results to Fabric destinations right from Desktop, handy for data gravity in OneLake.
Power BI Desktop on ARM: good news for battery and travel-friendly devices.
Custom visuals we’re eyeing
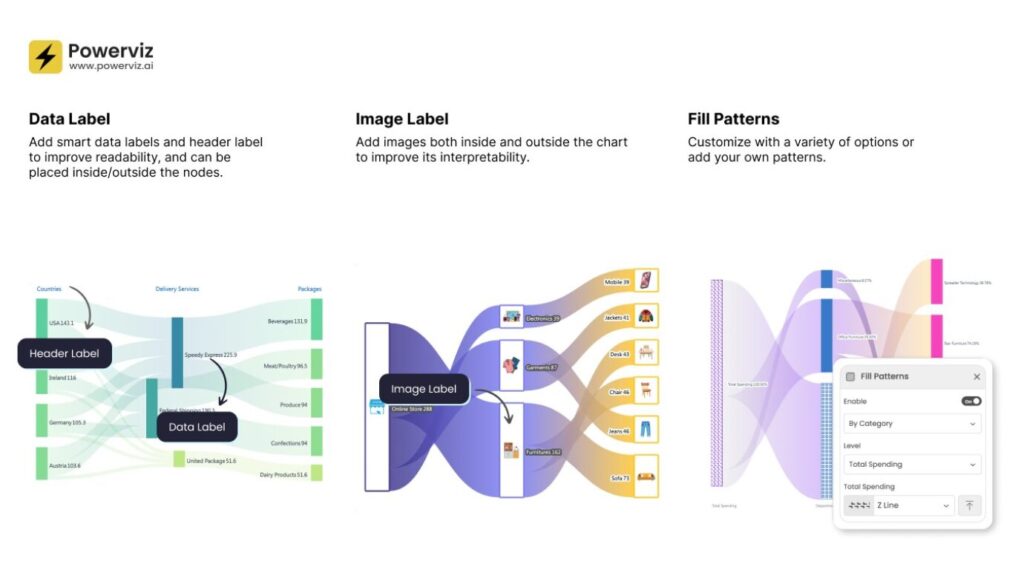
Sankey Chart by PowerViz – We love Powerviz’s craft, but licensing can sting, sometimes half the cost of a Pro license again, per user, for a single visual. That said, this Sankey looks fantastic: orientation options, conditional formatting, image labels, themes, smart labels… it’s a showcase visual for journeys and flow. If you have the budget and the use case, it’s hard to beat.
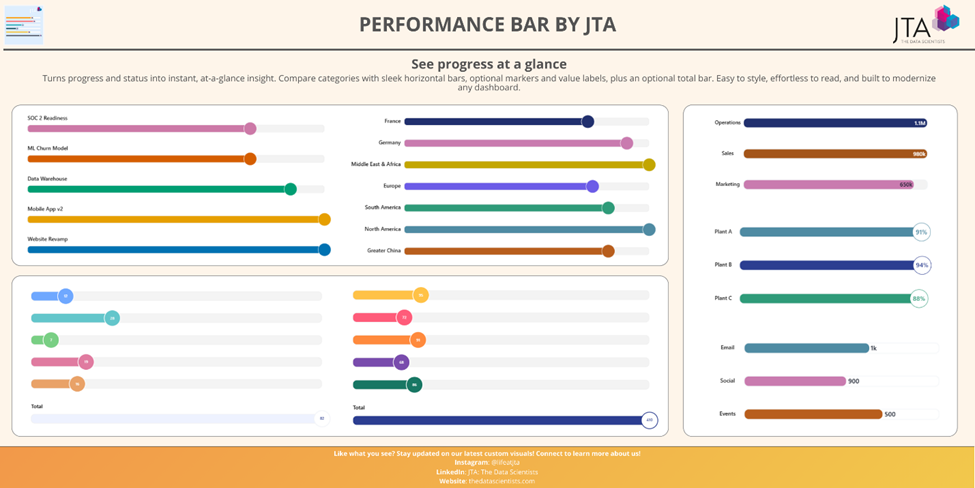
Performance Bar by JTA – A clean way to show progress bars with markers and totals. Yes, you can hack something similar with columns + error bars, but you’ll sacrifice tooltip polish and spend time maintaining the workaround. We’ll be testing this one because it promises the tidy look without the fiddly setup.
Community pulse (quick scan)
Map migration takes center stage across blogs and LinkedIn: “make a plan to convert” is the refrain – via Sum Product
“Grow to fit” gets real-world praise as a small change with big day-to-day payoff. Also a reminder that column-width control requests never die – via Medium
Button slicer cross-highlighting earns positive notes as a usability win – via LinkedIn
Final Thoughts
October isn’t flashy, but it’s useful. The maps transition is the right long-term call; Copilot drafting DAX where you work saves context switching; the Button slicer tweaks make reports easier to read; and “Grow to fit” is the kind of micro-delight that removes daily friction.
If you’ve got legacy Bing Maps, set a migration path to Azure Maps. Turn on “Grow to fit” for those nagging tables. Give Copilot a spin in DAX Query View for quick explorations. And if you’re splashing out on visuals, Powerviz’s Sankey is a looker, just keep an eye on the total bill.
For the full feature list and technical detail, see the official Power BI October Feature Summary.
Ready to Transform Your Reports?
If your Power BI reports are looking basic or tired, now is the perfect time to reach out to us. Our team specializes in transforming existing Power BI assets into cutting-edge designs that match your brand and elevate your data presentation. Contact us today to discuss your project and see how we can help.
In a hurry? We have professionally crafted Power BI templates ready to go in our Template Store.