
Pssst. Hey there.
In the world of data analysis, having flexible date ranges is crucial for generating insightful reports. Whether it’s comparing performance over the last few weeks, months, or years, a dynamic date picker can significantly enhance your Power BI dashboards. Today, we’ll delve into a powerful DAX script that creates a versatile calendar picker DAX table, allowing users to select and analyze various date ranges effortlessly.
You’ll need a Calendar table
This script assumes your data model includes a Calendar table named Calendar, with a date field named DateKey. Whether the table comes from your database or is generated using a calendar function, these names are required for the script to work properly.
The Script You’ll Need
Expand the following sections for the full script, followed by a breakdown of the script.
fn_calendar_picker =
VAR _datetable = Calendar
VAR _today = UTCNOW()+(11/24)
VAR _month = MONTH(UTCNOW()+(11/24))
VAR _year = YEAR(UTCNOW()+(11/24))
VAR _thisweekstart = UTCNOW()+(11/24) - WEEKDAY(UTCNOW()+(11/24),2)
VAR _thismonthstart = DATE(_year,_month,1)
VAR _thisyearstart = DATE(_year,1,1)
VAR _lastmonthstart = EDATE(_thismonthstart,-1)
VAR _lastmonthend = _thismonthstart-1
VAR _last3months = EDATE(_thismonthstart,-3)
VAR _last13months = EDATE(_thismonthstart,-13)
VAR _last25months = EDATE(_thismonthstart,-25)
VAR _thisquarterstart = DATE(YEAR(_today),SWITCH(true,_month>9,10,_month>6,7,_month>3,4,1),1)
VAR _lastquarterstart = EDATE(_thisquarterstart,-3)
VAR _lastyearstart = EDATE(_thisyearstart,-12)
VAR _lasttwoyearstart = EDATE(_thisyearstart,-24)

RETURN
    UNION (
        ADDCOLUMNS (
            FILTER (
                _datetable,
                FORMAT ( [DateKey], "mm-dd-yyyy" )
                    = FORMAT ( _today - 1, "mm-dd-yyyy" )
                    && FORMAT ( [DateKey], "mm-dd-yyyy" ) <= FORMAT ( _today, "mm-dd-yyyy" )
            ),
            "Period", " Yesterday",
            "Order", 2
        ),
        ADDCOLUMNS (
            FILTER ( _datetable, [DateKey] > _today - 7 && [DateKey] <= _today ),
            "Period", "Days - Last 07",
            "Order", 3
        ),
        ADDCOLUMNS (
            FILTER ( _datetable, [DateKey] > _today - 30 && [DateKey] <= _today ),
            "Period", "Days - Last 30",
            "Order", 5
        ),
        ADDCOLUMNS (
            FILTER ( _datetable, [DateKey] > _today - 91 && [DateKey] <= _today ),
            "Period", "Days - Last 90",
            "Order", 5
        ),
        ADDCOLUMNS (
            FILTER ( _datetable, [DateKey] > _today - 181 && [DateKey] <= _today ),
            "Period", "Days - Last 180",
            "Order", 5
        ),
        ADDCOLUMNS (
            FILTER ( _datetable, [DateKey] >= _thismonthstart && [DateKey] <= _today ),
            "Period", "Current Month",
            "Order", 2
        ),
        ADDCOLUMNS (
            FILTER ( _datetable, [DateKey] >= _thisyearstart && [DateKey] <= _today ),
            "Period", "Current Year",
            "Order", 3
        ),
        ADDCOLUMNS (
            FILTER ( _datetable, [DateKey] >= _thisquarterstart && [DateKey] <= _today ),
            "Period", "Current Quarter",
            "Order", 4
        ),
        ADDCOLUMNS (
            FILTER (
                _datetable,
                [DateKey] >= _lastmonthstart
                    && [DateKey] < _thismonthstart
            ),
            "Period", "Last Month",
            "Order", 5
        ),
        ADDCOLUMNS (
            FILTER (
                _datetable,
                [DateKey] >= _lastquarterstart
                    && [DateKey] < _thisquarterstart
            ),
            "Period", "Last Quarter",
            "Order", 6
        ),
        ADDCOLUMNS (
            FILTER ( _datetable, [DateKey] >= _lastyearstart && [DateKey] < _thisyearstart ),
            "Period", "Last Year",
            "Order", 7
        ),
        ADDCOLUMNS (
            FILTER ( _datetable, [DateKey] >= _last13months && [DateKey] <= _today ),
            "Period", "Last 13 Months",
            "Order", 9
        ),
        ADDCOLUMNS (
            FILTER ( _datetable, [DateKey] >= _last25months && [DateKey] <= _today ),
            "Period", "Last 25 Months",
            "Order", 10
        )
    )
The provided DAX script, fn_calendar_picker, is designed to generate dynamic date ranges based on the current date. Here’s a step-by-step breakdown of what this script does:
- Define the Date Table:
VAR _datetable = Calendar - Set the Current Date:
VAR _today = UTCNOW()+(11/24) - Extract Year, Month, and Start Dates:
VAR _month = MONTH(UTCNOW()+(11/24)) VAR _year = YEAR(UTCNOW()+(11/24)) VAR _thisweekstart = UTCNOW()+(11/24) - WEEKDAY(UTCNOW()+(11/24),2) VAR _thismonthstart = DATE(_year,_month,1) VAR _thisyearstart = DATE(_year,1,1) - Calculate Previous Periods:
VAR _lastmonthstart = EDATE(_thismonthstart,-1) VAR _lastmonthend = _thismonthstart-1 VAR _last3months = EDATE(_thismonthstart,-3) VAR _last13months = EDATE(_thismonthstart,-13) VAR _last25months = EDATE(_thismonthstart,-25) VAR _thisquarterstart = DATE(YEAR(_today),SWITCH(true,_month>9,10,_month>6,7,_month>3,4,1),1) VAR _lastquarterstart = EDATE(_thisquarterstart,-3) VAR _lastyearstart = EDATE(_thisyearstart,-12) VAR _lasttwoyearstart = EDATE(_thisyearstart,-24) - Return the Date Ranges: The
UNIONfunction combines multiple date range filters into a single table. EachADDCOLUMNSfunction filters the date table for a specific period and assigns a descriptive label and order:RETURN UNION ( ADDCOLUMNS ( FILTER ( _datetable, FORMAT ( [DateKey], "mm-dd-yyyy" ) = FORMAT ( _today - 1, "mm-dd-yyyy" ) && FORMAT ( [DateKey], "mm-dd-yyyy" ) <= FORMAT ( _today, "mm-dd-yyyy" ) ), "Period", " Yesterday", "Order", 2 ), ADDCOLUMNS ( FILTER ( _datetable, [DateKey] > _today - 7 && [DateKey] <= _today ), "Period", "Days - Last 07", "Order", 3 ), ADDCOLUMNS ( FILTER ( _datetable, [DateKey] > _today - 30 && [DateKey] <= _today ), "Period", "Days - Last 30", "Order", 5 ), ADDCOLUMNS ( FILTER ( _datetable, [DateKey] > _today - 91 && [DateKey] <= _today ), "Period", "Days - Last 90", "Order", 5 ), ADDCOLUMNS ( FILTER ( _datetable, [DateKey] > _today - 181 && [DateKey] <= _today ), "Period", "Days - Last 180", "Order", 5 ), ADDCOLUMNS ( FILTER ( _datetable, [DateKey] >= _thismonthstart && [DateKey] <= _today ), "Period", "Current Month", "Order", 2 ), ADDCOLUMNS ( FILTER ( _datetable, [DateKey] >= _thisyearstart && [DateKey] <= _today ), "Period", "Current Year", "Order", 3 ), ADDCOLUMNS ( FILTER ( _datetable, [DateKey] >= _thisquarterstart && [DateKey] <= _today ), "Period", "Current Quarter", "Order", 4 ), ADDCOLUMNS ( FILTER ( _datetable, [DateKey] >= _lastmonthstart && [DateKey] < _thismonthstart ), "Period", "Last Month", "Order", 5 ), ADDCOLUMNS ( FILTER ( _datetable, [DateKey] >= _lastquarterstart && [DateKey] < _thisquarterstart ), "Period", "Last Quarter", "Order", 6 ), ADDCOLUMNS ( FILTER ( _datetable, [DateKey] >= _lastyearstart && [DateKey] < _thisyearstart ), "Period", "Last Year", "Order", 7 ), ADDCOLUMNS ( FILTER ( _datetable, [DateKey] >= _last13months && [DateKey] <= _today ), "Period", "Last 13 Months", "Order", 9 ), ADDCOLUMNS ( FILTER ( _datetable, [DateKey] >= _last25months && [DateKey] <= _today ), "Period", "Last 25 Months", "Order", 10 ) )
Next, we’ll cover how to implement this script into Power BI and next steps.
How to Use This DAX Script
- Create a Date Table: Ensure you have a comprehensive date table (
Calendar) in your data model. This table should contain a column namedDateKeywith continuous dates covering the required period. - Implement the DAX Script: Create a new calculated table in your Power BI model and paste the
fn_calendar_pickerDAX script. This table will dynamically generate the specified date ranges.

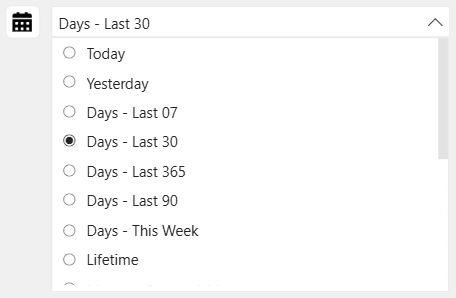
- Build Visuals: Use the generated date ranges in your visuals. For instance, create slicers or dropdowns to allow users to select different periods (e.g., “Last 30 Days”, “Current Month”) and dynamically update your reports.
Benefits of a Dynamic Date Picker
- Flexibility: Users can effortlessly switch between different timeframes, gaining various perspectives on the data.
- Efficiency: Predefined date ranges save time and reduce the complexity of creating custom date filters.
- Insightful Analysis: Comparing different periods becomes seamless, enabling better decision-making based on historical trends.
By incorporating this DAX script into your Power BI reports, you empower your users with a robust tool for dynamic date analysis. This enhances the overall user experience and drives more informed business decisions. The example below demonstrates how 20-Jul-2024 falls into multiple “Period” – which is right. When the user selects Last 7 Days or Last 13 Months, 20-Jul-2024 exists in both. Simply create your Slicer using Period as your field.
This article aims to provide a comprehensive understanding of the DAX script for creating a dynamic date picker in Power BI. If you need more personalized guidance or advanced customization, don’t hesitate to contact our consultancy for expert support.